
Methodology Overview
Key Model Inputs & Definitions
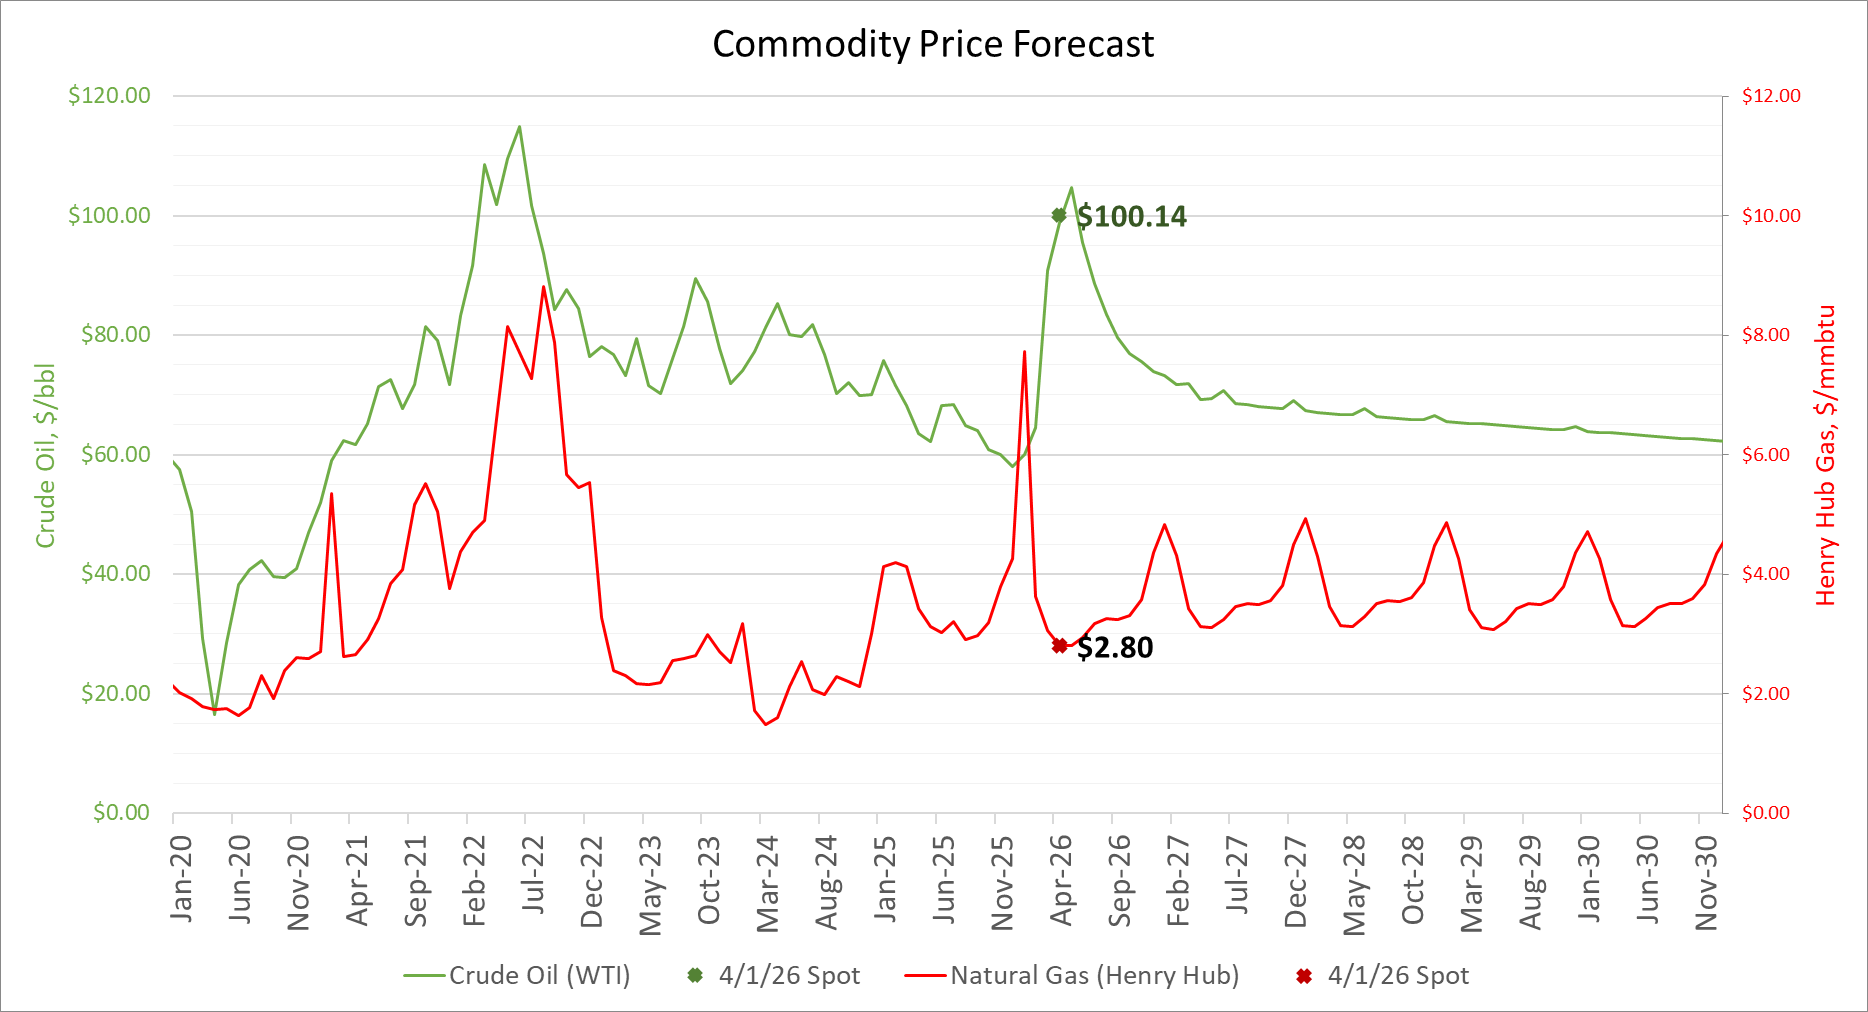
Commodity Pricing
Wells' Latest Monthly Revenue
Monthly revenue is calculated using historical commodity prices from the month of the latest available production
(often lagging 3–5 months). You can confirm the exact month by checking the “Last Production Date” for the well on
the Wells page and searching by its API-14 number. You can also navigate directly using: https://pecanestimate.com/portfolio/wells/[API14number].
For Fair Market Valuations
(Sales Estimate, Pecan Estimate, PDP/3P Forecasts, Lease Bonus)
A well or tract's fair market value and related measured (such as the "Sales Estimate (3P)", "Pecan Estimate", "Producing Wells (PDP)", "Future Drilling Potential (PDNP, PUD, PROB & POSS)", and "Lease Bonus") all use future commodity pricing, also known as "strip pricing". This future commodity prices are projected using the 124 month NYMEX future pricing of Crude Oil (WTI) and Natural Gas (Henry Hub). The value is then held flat for the remainder of the model. NGLs are priced at 45% of WTI Crude Oil pricing based on the trailing-twelve-month average blend of products approximating an NGL blend (45% Henry Hub Natural Gas, 25% Mont Belvieu propane, 25% Gulf Coast gasoline, and 5% WTI crude oil).
Definition of All Financial Summary
The following definition of market value will be used. Market Value is defined as “the price at which the tract would change hands between a willing buyer and a willing seller, neither being under any compulsion to buy or sell and both having reasonable knowledge of the relevant facts.”
Implicit in this definition is the consummation of a sale as of a specified date and the passing of title from seller to buyer under conditions where:
- Buyer and seller are typically motivated.
- Both parties are well informed or well advised, and acting in their own best interests.
- A reasonable time is allowed for exposure in the open market.
- Payment is made in U.S. dollars or comparable financial arrangements.
- The price represents the normal consideration for the tract sold, unaffected by special or creative financing or concessions.
Fair Market Value Considerations
The following considerations are factors which may influence market value on the part of a potential buyer and a potential seller at a given point in time.
- Sellers’ and buyers’ criteria in estimating value may typically be significantly higher or lower, respectively.
- Data regarding future production may vary due to the existence and capacity of available hydrocarbon gathering and transmission pipelines, effects of other facilities presently connected or those which may be connected at a future date to the same pipeline network, the future condition of the subject wells, and the manner in which they are utilized and maintained.
- Projected hydrocarbon prices over a given time are subjective and may depend on regional and overall hydrocarbon demand balancing and on complex regional, national, and global economic variables.
- Economic forecasts regarding the future price of hydrocarbons may be given a different weight by a seller versus a buyer.
- Future revenue projections may incorporate substantial levels of risk due to unpredictable future events and circumstances related to the wells’ mechanical condition, capabilities/decisions of the producer, hydrocarbon supply and demand, and other unanticipated events which may occur.
Petroleum Reserve Definitions
and Status Categories
According to the Society of Petroleum Engineers Petroleum Resources Management System (“SPE-PRMS”), petroleum reserves are generally broken down into three categories: Proved Reserves, Probable Reserves, and Possible Reserves. Proved Reserves are the highest valued category of reserves and have a “reasonable certainty” of being recovered, which means a high degree of confidence that the volumes will be recovered. Probable Reserves and Possible Reserves are lower categories of reserves, commonly combined and referred to as Unproved Reserves. Probable Reserves are volumes that are defined as “less likely” to be recovered than Proved Reserves, but more certain to be recovered than Possible Reserves. Possible Reserves are reserves which analysis of geological and engineering data suggests are “less likely” to be recoverable than Probable Reserves.
Reserves statuses are as follows:
- Developed Reserves are expected quantities to be recovered from existing wells and facilities.
- Developed Producing Reserves (PDP) are expected to be recovered from completion intervals that are open and producing at the time of the estimate.
- Developed Non-Producing Reserves (PDNP) include shut-in and behind-pipe Reserves. For this appraisal, wells that have spud but not yet produced are considered PDNP.
- Undeveloped Reserves are quantities expected to be recovered through future investments.
Present Worth Discount Rate
and Reserve Adjustment Factors
This appraiser has found that a royalty interest in a proved, producing tract in an active oil & gas play which has a steady income typically reconciles at a present worth discount factor of 10%. This discount percent is supported by the Society of Petroleum Evaluation Engineers Economic Survey (SPEE 2025). For undeveloped tracts, discount rates can be increased to reflect increased risk of returns as reserves become less certain. Risk Adjusted Discount Rates (RADR) address uncertainty in the timing of the future cash flows, and Reserve Adjustment Factors (RAF) address uncertainty in the volume of future cash flow. This appraiser has used a combination of RADR and RAF to establish fair market value of the Subject Tract.
| Reserve Category | Risk Adjusted Discount Rate | Reserve Adjustment Factor |
|---|---|---|
| Proved Developed Producing | 10% | 100% |
| Proved Developed Non-Producing | 10% | 80% |
| Proved Undeveloped | 20% | 55% |
| Probable Undeveloped | 30% | 25% |
| Possible Undeveloped | 40% | 10% |
Undeveloped Value Methodology
Engineering Type Curve Analogy
To establish proven reservoir in an unconventional play, the proximity and density of development of the reservoir is used. Acreage is deemed “proven” using a 1-mile radius to establish production in the same reservoir, then applied volumes in line with the average production for such a well after normalizing for lateral length. This is consistent with the type curve methodology outlined in SPEE Monographs 3 and 4.
To estimate average production for future developed wells, a type well (or mock well) was developed using the analogous area wells to create an average production plot. Wells older than 2017 were excluded due to improvements in industry drilling and completion techniques and technology affecting the well performance. Decline Curve Analysis was then used to forecast a modified Arps hyperbolic decline with a 7% terminal exponential decline and an appropriate max b-factor for the reservoir, where applicable.
These mock wells were then normalized to the localized trend of lateral length (ranging 5,000-10,000’) and the drilling and completion costs estimated based on depth, length, and completion type. Cost, performance, timing, commodity prices, and other economic inputs are then modeled to predict future revenues and expenses. A mock well drilled in each of the reservoirs is required to have an Internal Rate of Return (IRR) for the working interest owner of at least over 20%, which theoretically makes drilling the well economically viable at current commodity pricing.
Undeveloped Value Methodology
Proximity-Based Intrinsic Value
When there are no reserves (producing or undeveloped) in an area to value using an engineering cash flow analysis, our model uses a proprietary proximity model which looks at the value and activity in the surrounding 20 miles. This model is further tuned using reported lease bonus data and comparable sales.
This method accounts for the intrinsic value of minerals being higher when closer to known reserves, but is not a formal industry method. For example, tract in an area that has more production around it will have simply due to the potential for future discoveries. Intrinsic value extends beyond quantifiable measurements but is intended to encompass the inherent worth of a tract.
This value is speculative and does not account for any technological or geological developments that may not yet be public knowledge. Prior to these developments becoming public and then built into our model, this intrinsic value method captures production from new wells to influence the surrounding value of an area.
If you have reason to believe that this area should have undeveloped value attributed to a specific reservoir we do not have listed, please don't hesitate to contact us. We would be more than happy to reevaluate the area and provide you with an updated report.
References and Data Sources
- Production data, permits, rig location, and well status data sourced from WellDatabase.com
- NYMEX crude oil futures sourced from https://www.investing.com/commodities/crude-oil-contracts
- NYMEX natural gas futures sourced from https://www.investing.com/commodities/natural-gas-contracts
- Appraisal Standards Board. 2020. Uniform Standards of Professional Appraisal Practice. 2020–2021 ed. The Appraisal Foundation.
- Society of Petroleum Engineers. 2018. Petroleum Resources Management System. https://www.spe.org/en/industry/reserves/.
- SPE Oil & Gas Reserves Committee. 2007. “SPE/WPC/AAPG/SPEE Petroleum Resources Management System (PRMS).” 2007. https://www.spe.org/industry/docs/PRMS-Process-2007.pdf.
- Society of Petroleum Evaluation Engineers. 2023. “Annual Survey of Parameters Used in Tract Evaluations.” Presented at the Annual Meeting of the Society of Petroleum Evaluation Engineers.